Lesson 7: Fee Optimization and Gas Economics
🎯 Core Concept: Fees Must Exceed Costs
Gas costs can eat your profits. This lesson teaches you to optimize fee tiers, minimize gas expenses, and calculate when LPing is actually profitable after accounting for all costs.
💸 Understanding Fee Tiers
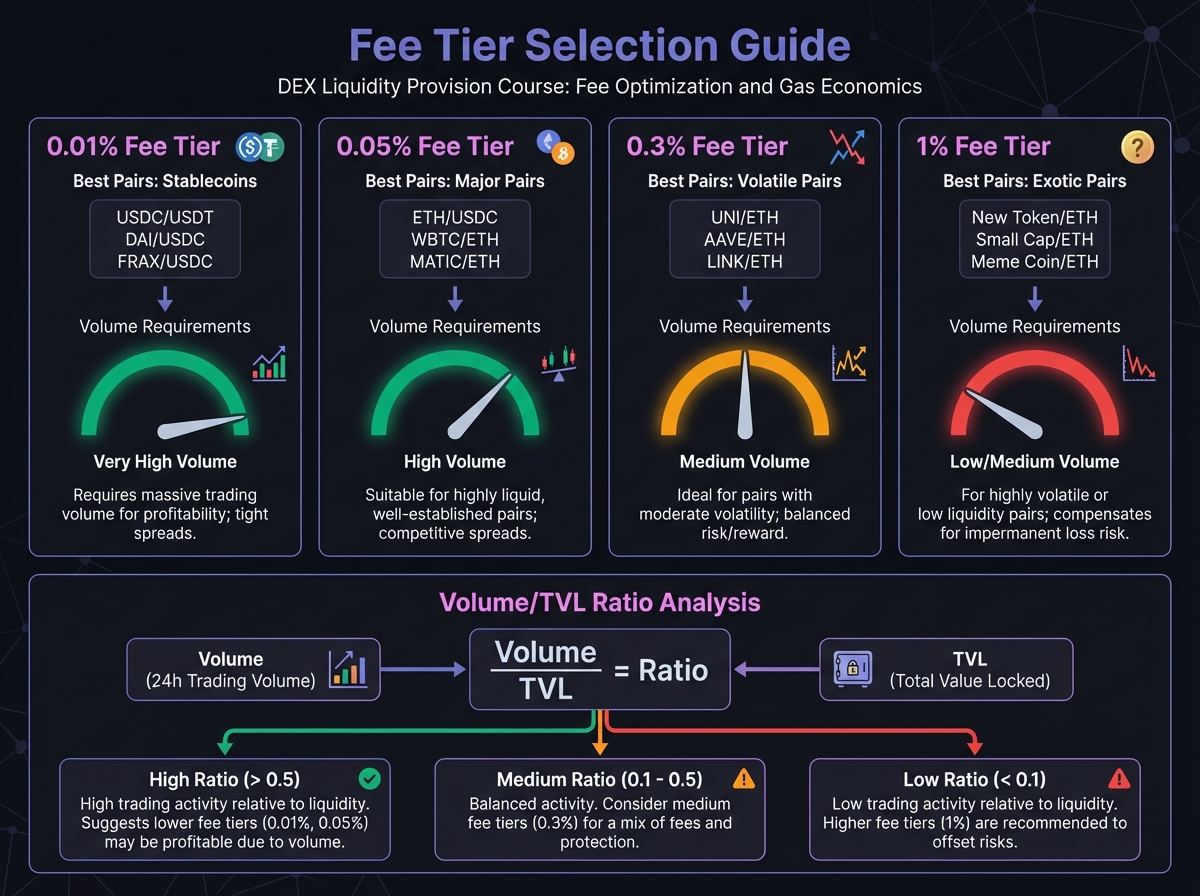
Uniswap Fee Tiers
0.01% (1 bp): Ultra-stable pairs (USDC/DAI, USDT/USDC)
- Lowest fees for traders
- Highest volume
- Requires tight ranges (V3) or high TVL (V2)
0.05% (5 bp): Standard for major pairs (ETH/USDC, WBTC/ETH)
- Balance of fees and volume
- Most popular tier
- Best for beginners
0.3% (30 bp): Volatile pairs, legacy V2 standard
- Higher fees compensate for IL risk
- Lower volume than 0.05%
- Good for exotic pairs
1% (100 bp): Highly volatile, exotic pairs
- Maximum fee protection
- Lowest volume
- Use only for very risky pairs
Fee Tier Selection Framework
Choose 0.01% if:
- Stablecoin pair
- High correlation (wstETH/ETH)
- Can manage tight ranges
Choose 0.05% if:
- Major blue-chip pairs
- Moderate volatility
- Want balance of fees and volume
Choose 0.3% if:
- Volatile pairs
- Lower liquidity
- Need higher fees to offset IL
Choose 1% if:
- Meme coins
- Very new tokens
- Extreme volatility expected
⛽ Gas Economics: L1 vs L2
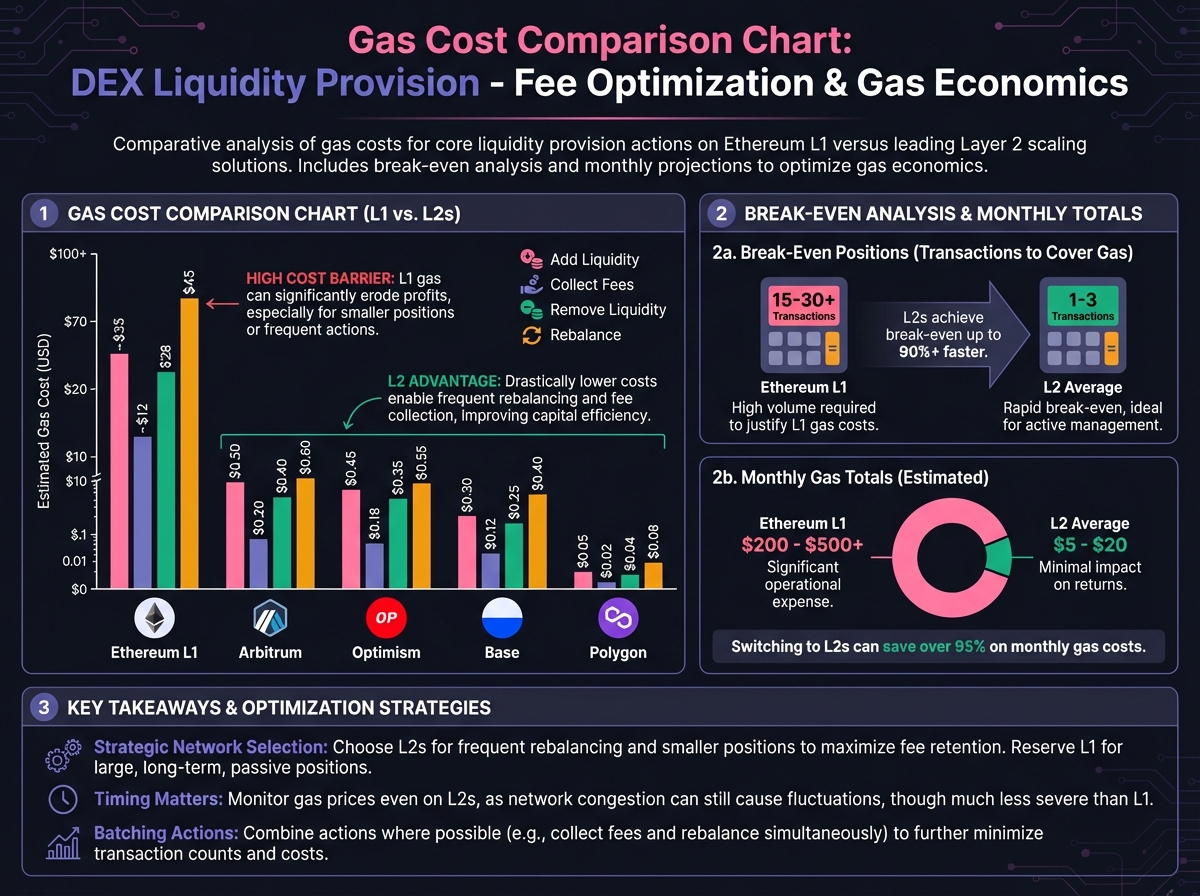
Ethereum Mainnet (L1) Costs
Typical Gas Costs:
- Add liquidity: $50-150
- Remove liquidity: $30-100
- Collect fees (V3): $20-50
- Rebalance: $100-300
Break-Even Analysis:
- Minimum position: $25,000-50,000
- Need fees > $200/month to justify gas
- Only viable for large, passive positions
Layer 2 Costs
Arbitrum/Optimism:
- Add liquidity: $0.50-2.00
- Remove liquidity: $0.30-1.50
- Collect fees: $0.20-1.00
- Rebalance: $1.00-5.00
Break-Even Analysis:
- Minimum position: $500-1,000
- Viable for active management
- Can rebalance frequently
Base/Polygon:
- Even lower costs ($0.10-0.50 per transaction)
- Minimum position: $100-500
- Best for small LPs
Gas Optimization Strategies
1. Batch Operations:
- Approve both tokens in one session
- Add liquidity immediately after approval
- Don't let approvals expire
2. Time Your Transactions:
- Gas is lower on weekends
- Avoid high-traffic times (US market hours)
- Use gas trackers (ETH Gas Station)
3. Use L2:
- 100x cheaper than L1
- Same security (inherited)
- Growing liquidity
4. Minimize Rebalancing:
- Set wider ranges (less frequent rebalancing)
- Use stable pairs (less IL, less rebalancing)
- Monitor but don't over-manage
📊 Volume/TVL Ratio Analysis
The Critical Metric
Formula: Volume/TVL Ratio = Daily Volume ÷ Total Value Locked
Interpretation:
- Ratio > 0.5: Excellent (high fees per dollar)
- Ratio 0.1-0.5: Good
- Ratio < 0.1: Poor (low fees, avoid)
Real-World Example
Pool A:
- TVL: $10,000,000
- Daily Volume: $2,000,000
- Ratio: 0.2 (Good)
Pool B:
- TVL: $100,000,000
- Daily Volume: $1,000,000
- Ratio: 0.01 (Poor - avoid!)
Your $10,000 position:
-
Pool A: $10,000 ÷ $10M = 0.1% share
-
Daily fees: $2M × 0.003 × 0.001 = $6/day
-
Monthly: $180
-
Pool B: $10,000 ÷ $100M = 0.01% share
-
Daily fees: $1M × 0.003 × 0.0001 = $0.30/day
-
Monthly: $9
Result: Pool A generates 20x more fees despite lower TVL!

💰 Fee Calculation Framework
Expected Fee Formula
Daily Fees = (Daily Volume × Fee Rate × Your Share) - Gas Costs
Your Share = Your Capital ÷ Total TVL
Monthly Fees = Daily Fees × 30
Annual Fees = Monthly Fees × 12
Complete Example
Setup:
- Capital: $10,000
- Pool TVL: $1,000,000
- Daily Volume: $500,000
- Fee Rate: 0.05%
- Network: Arbitrum (L2)
Calculations:
- Your share: $10,000 ÷ $1,000,000 = 1%
- Daily fees: $500,000 × 0.0005 × 0.01 = $2.50
- Monthly fees: $2.50 × 30 = $75
- Annual fees: $75 × 12 = $900
Gas costs (monthly):
- Add liquidity: $2 (one-time, amortized)
- Collect fees: $1 × 4 = $4 (weekly)
- Rebalance: $3 × 2 = $6 (bi-weekly)
- Total gas: $12/month
Net fees: $75 - $12 = $63/month = $756/year
APY: $756 ÷ $10,000 = 7.56% (before IL!)
🎯 Fee Optimization Strategies
Strategy 1: High Volume Pools
Target: Volume/TVL ratio > 0.3 Benefit: Maximum fees per dollar Risk: May have higher competition
Strategy 2: Emerging Pools
Target: New pools with growing volume Benefit: Get in early, capture growth Risk: Volume may not materialize
Strategy 3: Fee Tier Arbitrage
Target: Same pair, different fee tiers Benefit: Capture volume shifts Risk: Requires monitoring multiple positions
Strategy 4: Cross-Protocol Optimization
Target: Same pair on different protocols Benefit: Capture best fees/emissions Risk: More complex management
🔬 Advanced Deep-Dive: Dynamic Fee Models
Meteora's Dynamic Fees
Meteora adjusts fees based on:
- Volatility: Higher volatility = higher fees
- Utilization: Higher usage = higher fees
- Market conditions: Adaptive to market state
Formula (simplified): $$Fee = BaseFee \times (1 + VolatilityMultiplier) \times UtilizationFactor$$
Benefit: LPs earn more during high volatility (compensating IL risk)
Uniswap V4 Hooks (Future)
V4 will allow custom fee logic via hooks:
- Time-weighted fees
- Volatility-based fees
- Utilization-based fees
Implication: More sophisticated fee optimization strategies coming
🎓 Beginner's Corner: Fee Optimization Mistakes
Mistake 1: Choosing wrong fee tier
- Fix: Match tier to pair volatility
Mistake 2: Ignoring gas costs
- Fix: Always calculate net fees (fees - gas)
Mistake 3: Low Volume/TVL ratio
- Fix: Check ratio before depositing
Mistake 4: Using L1 for small positions
- Fix: Always use L2 for positions <$25k
Mistake 5: Over-optimizing fees
- Fix: Balance fees with IL risk and management time
📈 Real-World Optimization Example
Scenario: $20,000 to deploy
Option A: Uniswap V3 (L1), ETH/USDC, 0.05% tier
- TVL: $50M, Daily Volume: $10M
- Your share: 0.04%
- Daily fees: $10M × 0.0005 × 0.0004 = $2
- Monthly: $60
- Gas (monthly): $50
- Net: $10/month
Option B: Uniswap V3 (Arbitrum), ETH/USDC, 0.05% tier
- Same pool, L2
- Daily fees: $2 (same)
- Monthly: $60
- Gas (monthly): $5
- Net: $55/month
Option C: Aerodrome (Base), WETH/USDC, sAMM
- TVL: $5M, Daily Volume: $2M
- Your share: 0.4%
- Daily fees: $2M × 0.0005 × 0.004 = $4
- Daily emissions: $6 (estimated)
- Monthly: $300
- Gas (monthly): $3
- Net: $297/month
Winner: Option C (Aerodrome) - 30x better than Option A!
Interactive Fee Accumulation Calculator
Use this calculator to compare fee accumulation across different fee tiers, protocols, and gas costs to optimize your profitability:
🔑 Key Takeaways
- Fee tiers matter - match to pair volatility
- Volume/TVL ratio is critical - check before depositing
- Gas costs kill small positions - use L2
- Calculate net fees - fees minus gas, minus IL
- High volume pools generate more fees per dollar
- Cross-protocol comparison can reveal better opportunities
- Dynamic fees (Meteora) adapt to market conditions
🚀 Next Steps
Lesson 8 covers advanced risk management and hedging - essential for protecting capital when fees alone aren't enough. Learn to hedge IL and manage portfolio risk.
Complete Exercise 7 to calculate optimal fee tiers and analyze gas economics for your positions.
Remember: Fees must exceed gas costs + IL to be profitable. Always calculate net returns, not just gross fees. Optimization is the difference between profitable and unprofitable LPing.
← Back to Summary | Next: Exercise 7 → | Previous: Lesson 6 ←