Lesson 2: The Mathematics of Perpetual Trading
🎯 Core Concept: Math is Your Protection
Understanding the mathematics behind perpetual futures isn't just academic—it's your primary defense against losses. These formulas determine:
- How much leverage you can safely use
- When your position becomes vulnerable to liquidation
- What funding costs you'll pay or receive
- Whether a position is profitable after accounting for fees
Master these calculations, and you'll make informed decisions, avoid costly mistakes, and optimize your returns.
💰 Funding Rate Calculations
The Funding Rate Formula
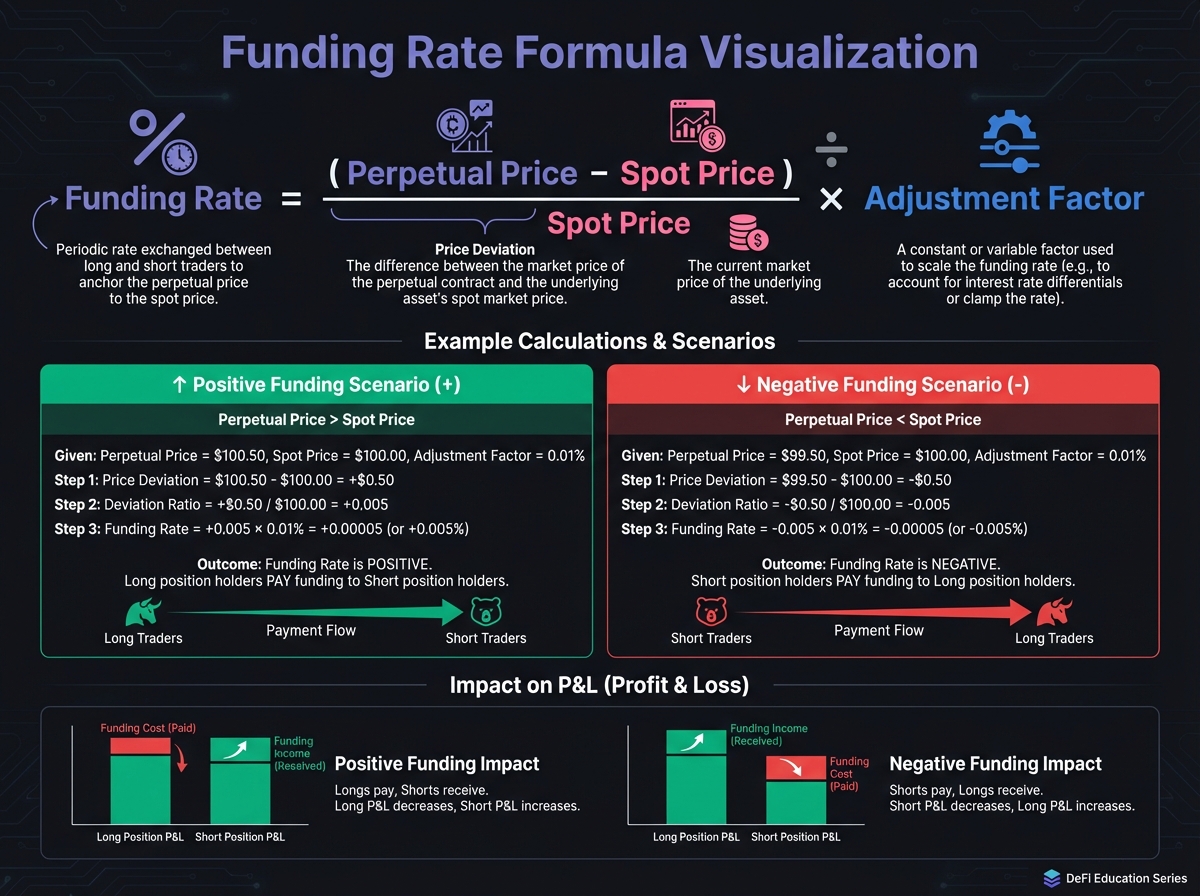
The funding rate keeps perpetual prices aligned with spot prices:
$$Funding Rate = \frac{Perpetual Price - Spot Price}{Spot Price} \times Adjustment Factor$$
Key Points:
- Positive Funding: Perp > Spot → Longs pay shorts
- Negative Funding: Perp < Spot → Shorts pay longs
- Adjustment Factor: Varies by protocol (typically 0.01-0.1)
Calculating Funding Payments
Funding Payment Formula:
$$Funding Payment = Position Size \times Funding Rate$$
Where:
- Position Size = Notional value of your position (not just margin)
- Funding Rate = Current funding rate (usually hourly or 8-hourly)
Example: Funding Cost Calculation
Scenario: Long ETH perpetual position
- Position Size: $10,000 (5x leverage on $2,000 margin)
- Funding Rate: 0.01% per hour (positive, so you pay)
- Holding Period: 24 hours
Calculation:
- Hourly Payment: $10,000 × 0.0001 = $1.00
- Daily Payment: $1.00 × 24 = $24.00
- Annualized: 0.01% × 24 × 365 = 87.6% APR
Key Insight: On a $2,000 margin position, paying $24/day means you're losing 1.2% of your capital daily just to funding. If ETH only moves 1% in your favor, you're still down!
Annualized Funding Rates
To compare funding across protocols with different calculation frequencies:
$$Annualized Rate = Funding Rate \times Frequency \times 365$$
Example:
- Hourly funding: 0.01% × 24 hours × 365 days = 87.6% APR
- 8-hourly funding: 0.05% × 3 times/day × 365 days = 54.75% APR
Warning: Annualized funding rates above 50% are extremely expensive. Always check before opening positions.

📊 Margin Requirements
Initial Margin
The minimum collateral required to open a position:
$$Initial Margin = \frac{Position Size}{Leverage}$$
Example:
- Position Size: $10,000
- Leverage: 10x
- Initial Margin: $10,000 ÷ 10 = $1,000
Maintenance Margin
The minimum collateral required to keep a position open (usually 50-80% of initial margin):
$$Maintenance Margin = Position Size \times Maintenance Margin Rate$$
Example:
- Position Size: $10,000
- Maintenance Margin Rate: 0.5% (typical for 10x leverage)
- Maintenance Margin: $10,000 × 0.005 = $50
Critical: If your margin falls below maintenance, you're liquidated.
Margin Ratio
Your current margin relative to position size:
$$Margin Ratio = \frac{Current Margin}{Position Size} \times 100%$$
Example:
- Current Margin: $1,200
- Position Size: $10,000
- Margin Ratio: ($1,200 ÷ $10,000) × 100% = 12%
Safety Levels:
- Safe: Margin Ratio > 20% (for 10x leverage)
- Warning: Margin Ratio 10-20%
- Danger: Margin Ratio < 10% (approaching liquidation)

⚠️ Liquidation Price Calculations
For Long Positions
$$Liquidation Price = Entry Price \times \left(1 - \frac{Initial Margin}{Position Size}\right)$$
Or more simply:
$$Liquidation Price = Entry Price \times \left(1 - \frac{1}{Leverage} + Maintenance Margin Buffer\right)$$
Example: Long ETH at $2,500 with 10x leverage
- Entry Price: $2,500
- Leverage: 10x
- Maintenance Margin: 0.5%
Calculation:
- Liquidation Price = $2,500 × (1 - 0.10 + 0.005)
- Liquidation Price = $2,500 × 0.905 = $2,262.50
Interpretation: If ETH drops to $2,262.50, you're liquidated.
For Short Positions
$$Liquidation Price = Entry Price \times \left(1 + \frac{Initial Margin}{Position Size}\right)$$
Example: Short ETH at $2,500 with 10x leverage
- Entry Price: $2,500
- Leverage: 10x
- Maintenance Margin: 0.5%
Calculation:
- Liquidation Price = $2,500 × (1 + 0.10 - 0.005)
- Liquidation Price = $2,500 × 1.095 = $2,737.50
Interpretation: If ETH rises to $2,737.50, you're liquidated.
Safety Buffer Calculation
The price movement you can withstand before liquidation:
$$Safety Buffer = \frac{Current Price - Liquidation Price}{Current Price} \times 100%$$
Example:
- Current Price: $2,500
- Liquidation Price: $2,262.50
- Safety Buffer: ($2,500 - $2,262.50) ÷ $2,500 × 100% = 9.5%
Recommendation: Maintain at least 20-30% safety buffer to avoid liquidation from normal volatility.

🔢 Position Sizing Mathematics
Maximum Position Size
Given your available margin and desired leverage:
$$Max Position Size = Available Margin \times Leverage$$
Example:
- Available Margin: $1,000
- Desired Leverage: 5x
- Max Position Size: $1,000 × 5 = $5,000
Optimal Position Size
Based on risk tolerance and liquidation buffer:
$$Optimal Position Size = \frac{Available Margin \times Leverage}{1 + Safety Buffer}$$
Example:
- Available Margin: $1,000
- Leverage: 5x
- Desired Safety Buffer: 30%
Calculation:
- Optimal Position Size = ($1,000 × 5) ÷ 1.30
- Optimal Position Size = $5,000 ÷ 1.30 = $3,846
This gives you a 30% buffer before liquidation.
📈 Profit and Loss Calculations
P&L for Long Positions
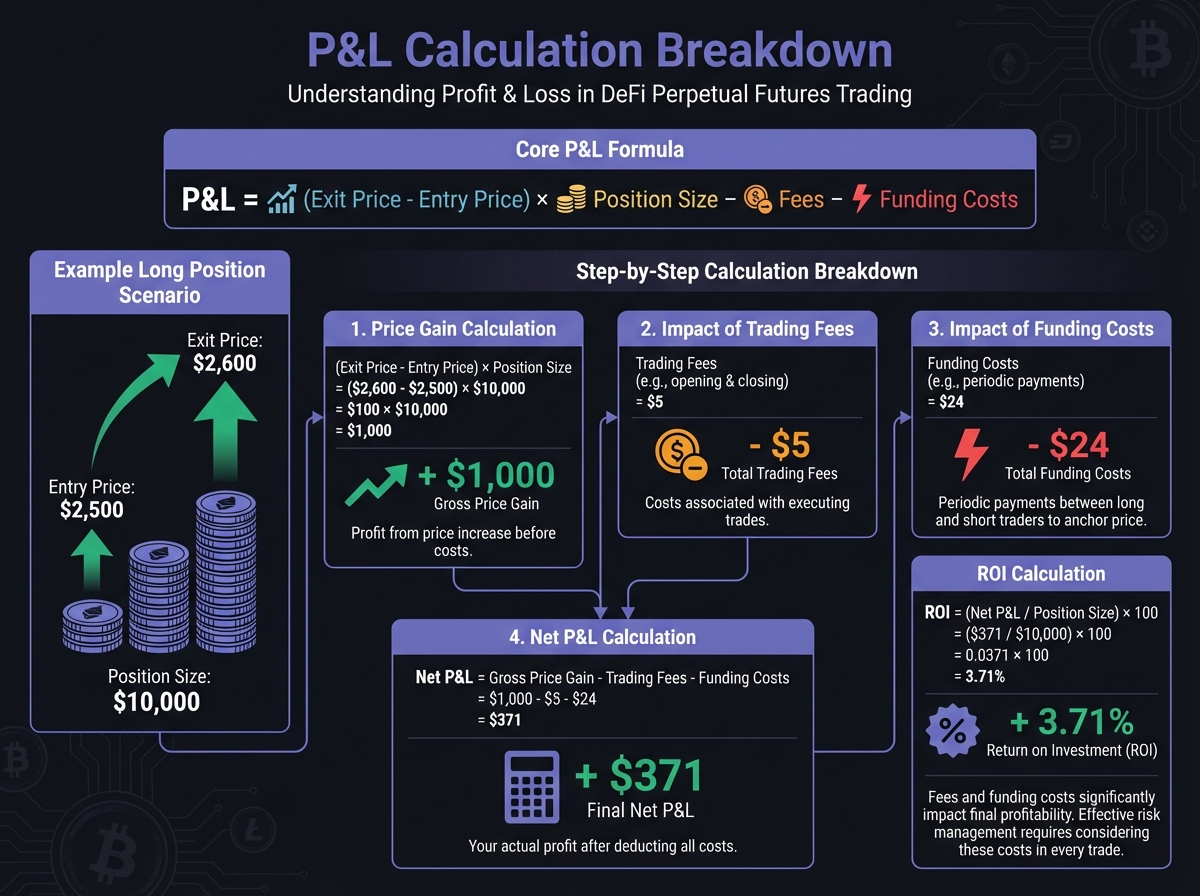
$$P&L = (Exit Price - Entry Price) \times Position Size - Fees - Funding Costs$$
Example: Long ETH
- Entry Price: $2,500
- Exit Price: $2,600
- Position Size: $10,000 (5x leverage on $2,000 margin)
- Trading Fees: 0.05% ($5)
- Funding Costs: $24 (24 hours at 0.01%/hour)
Calculation:
- Price Gain: ($2,600 - $2,500) ÷ $2,500 = 4%
- Dollar Gain: $10,000 × 0.04 = $400
- Net P&L: $400 - $5 - $24 = $371
- ROI: $371 ÷ $2,000 = 18.55%
P&L for Short Positions
$$P&L = (Entry Price - Exit Price) \times Position Size - Fees - Funding Costs$$
Example: Short ETH
- Entry Price: $2,500
- Exit Price: $2,400
- Position Size: $10,000
- Trading Fees: 0.05% ($5)
- Funding Received: $24 (negative funding, you receive)
Calculation:
- Price Gain: ($2,500 - $2,400) ÷ $2,500 = 4%
- Dollar Gain: $10,000 × 0.04 = $400
- Net P&L: $400 - $5 + $24 = $419
- ROI: $419 ÷ $2,000 = 20.95%
🎓 Beginner's Corner: Common Calculation Mistakes
Mistake 1: Ignoring Funding Costs
The Error: "I made 5% on my trade, great!"
The Reality: If you paid 2% in funding over 24 hours, your net return is only 3%.
The Fix: Always calculate net P&L including funding.
Mistake 2: Misunderstanding Liquidation Price
The Error: "With 10x leverage, I'm safe until price drops 10%."
The Reality: Maintenance margin means liquidation occurs around 9-9.5% (not 10%).
The Fix: Use the liquidation price calculator, don't estimate.
Mistake 3: Confusing Position Size with Margin
The Error: "I have $1,000, so I can trade $1,000 worth."
The Reality: With 10x leverage, $1,000 margin = $10,000 position size.
The Fix: Always distinguish between margin (collateral) and position size (notional value).
🔬 Advanced Deep-Dive: Funding Rate Dynamics
Why Funding Rates Vary
Funding rates fluctuate based on:
- Market Sentiment: Extreme bullishness → high positive funding
- Open Interest Imbalance: More longs than shorts → longs pay
- Arbitrage Activity: Low arbitrage → higher funding needed
- Protocol Design: Some protocols have caps, others don't
Funding Rate Impact on Returns
Scenario: Holding a long position for 7 days
- Position Size: $10,000
- Funding Rate: 0.02% per hour (high positive)
- Daily Funding: $10,000 × 0.0002 × 24 = $48
- Weekly Funding: $48 × 7 = $336
If ETH moves 2% in your favor:
- Price Gain: $10,000 × 0.02 = $200
- Net P&L: $200 - $336 = -$136 (LOSS)
Key Insight: High funding rates can turn profitable price moves into losses. Always check funding before opening positions.
Break-Even Analysis
Calculate the minimum price movement needed to cover costs:
$$Break-Even Price Movement = \frac{Fees + Funding Costs}{Position Size} \times 100%$$
Example:
- Fees: $5
- Funding Costs (24h): $24
- Position Size: $10,000
Calculation:
- Break-Even: ($5 + $24) ÷ $10,000 × 100% = 0.29%
You need at least 0.29% price movement just to break even.
📊 Real-World Example: Complete Position Analysis
Setup:
- Long ETH at $2,500
- Margin: $2,000
- Leverage: 5x
- Position Size: $10,000
- Funding Rate: 0.01% per hour
- Trading Fees: 0.05%
Calculations:
-
Liquidation Price:
- = $2,500 × (1 - 0.20 + 0.01) = $2,025
-
Safety Buffer:
- = ($2,500 - $2,025) ÷ $2,500 = 19%
-
Daily Funding Cost:
- = $10,000 × 0.0001 × 24 = $24/day
-
Break-Even Price Movement:
- = ($5 + $24) ÷ $10,000 = 0.29%
-
If ETH goes to $2,600 (4% gain):
- Price Gain: $400
- Fees: $5
- Funding (24h): $24
- Net P&L: $400 - $5 - $24 = $371
- ROI: 18.55%
-
If ETH goes to $2,025 (liquidation):
- Loss: $2,000 (entire margin)
- ROI: -100%
🛠️ Interactive Calculators
Practice these calculations with our interactive tools:
Leverage & Liquidation Calculator

Funding Rate Calculator

Launch Funding Rate Calculator →
P&L Calculator

🔑 Key Takeaways
- Funding rates can be extremely expensive—always check before opening positions
- Liquidation price is NOT simply (1 - 1/leverage)—maintenance margin matters
- Position size (notional) ≠ Margin (collateral)—understand the difference
- Calculate net P&L including fees and funding costs
- Maintain 20-30% safety buffer above liquidation price
- Break-even analysis helps determine if a trade is worth it
🚀 Next Steps
- Proceed to Lesson 3 to understand different architecture types (CLOB vs Oracle pools)
- Practice these calculations with the Exercise 2 worksheet
- Use a liquidation calculator before opening any position
- Monitor funding rates on your chosen protocol
Next Lesson: In Lesson 3, we'll explore architecture types and market structure.